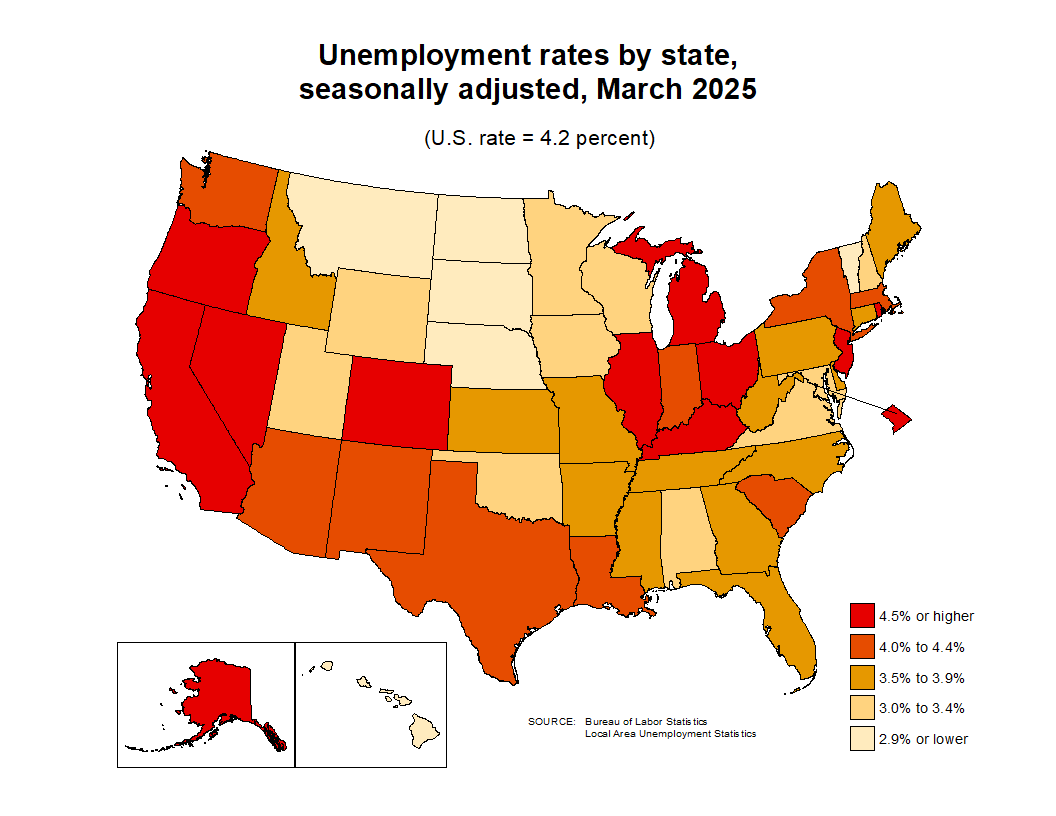
Unemployment Rate by State: Your Complete Guide to Labor Statistics

Select a state above to view detailed unemployment statistics

Select a state above to view detailed unemployment statistics
Understanding unemployment patterns across different states is crucial for economists, policymakers, job seekers, and businesses making strategic decisions. The unemployment rate serves as a vital economic indicator that reflects the health of regional job markets and provides insights into economic trends that affect millions of Americans.
The unemployment rate represents the percentage of the labor force that is actively looking for work but currently unemployed. This metric, regularly reported by the Bureau of Labor Statistics, offers a snapshot of economic conditions across states and the District of Columbia. However, raw numbers only tell part of the story – comprehensive analysis requires examining trends, seasonal adjustments, and comparative rankings.
Modern data visualization tools like this dashboard have revolutionized how we interpret unemployment data. Interactive platforms now allow users to explore unemployment rates by state through dynamic charts and real-time statistics, making complex economic data accessible to everyone from researchers to curious citizens.
The Bureau of Labor Statistics employs rigorous methodology to ensure accurate unemployment data collection. The civilian labor force includes all people who are employed or actively seeking work, excluding military personnel and those not participating in the workforce. This civilian labor force serves as the foundation for calculating meaningful unemployment rates.
Data collection involves surveying households monthly to determine employment status. The bureau distinguishes between those who are unemployed and actively looking for work versus those who have stopped seeking employment entirely. This methodology ensures that unemployment rate measures reflect genuine job market conditions rather than statistical anomalies.
Seasonally adjusted data helps economists identify underlying trends by removing predictable seasonal variations in employment patterns. For instance, retail employment typically increases during holiday seasons, while construction jobs may decline during winter months in certain regions.
Unemployment rates by state reveal significant regional variations that reflect local economic conditions, industry concentrations, and policy impacts. States with diversified economies often maintain more stable employment levels, while regions dependent on specific industries may experience higher volatility.
The highest unemployment rate often occurs in states facing economic transitions, natural disasters, or industry-specific challenges. Conversely, states with the lowest unemployment rate typically benefit from strong local economies, business-friendly policies, or advantageous geographic locations.
Labor force participation rate differences across states provide additional context for understanding employment dynamics. This metric measures the percentage of working-age adults who are either employed or actively looking for work. States may have low unemployment rates but also low participation rates, indicating different underlying economic conditions.
Some states experience rate increases due to population growth outpacing job creation, while others see the jobless rate increases during economic downturns or industry-specific challenges. Understanding these patterns requires examining both short-term fluctuations and long-term trends.
This dashboard offers interactive state and county selection capabilities, allowing you to drill down from national trends to local area unemployment statistics. The platform features dropdown menus with full state names for easy navigation, coupled with optional county selectors that can aggregate data across all counties within a state.
Effective unemployment analysis requires examining both unemployment rates and labor force trends simultaneously. The unemployment rate chart displays percentage changes over time, typically spanning from 1990 to 2024, using distinctive red theming for clarity. Meanwhile, the labor force chart shows workforce size trends in blue, helping users understand whether unemployment changes reflect job losses or labor force expansion.
Current unemployment statistics provide immediate snapshots of state economic health. The latest unemployment rate, combined with labor force size data, creates a comprehensive picture of state employment conditions. State rankings based on current data help identify which regions are performing best and worst economically.
Advanced analytical tools identify the best and worst years for each state's unemployment rate, revealing historical patterns and economic cycles. Average rates over extended periods help normalize short-term fluctuations and identify long-term trends.
Trend analysis capabilities determine whether unemployment is increasing, decreasing, or remaining unchanged, with magnitude indicators showing whether changes represent significant increases or gradual adjustments. Per-year change calculations provide precise measurements of trend direction and speed.
When analyzing unemployment data at the county level, effective aggregation becomes crucial. Labor force totals represent the sum of all county workforces, while unemployment rates require weighted averaging based on labor force size to ensure accurate state-level representations.
The number of unemployed people varies significantly across states, influenced by both total population and economic conditions. States with larger populations naturally have higher absolute numbers of unemployed individuals, making percentage-based comparisons more meaningful than raw figures.
Understanding unemployment requires considering broader economic factors including recession impacts, job market dynamics, and employment sector changes. Part-time employment trends also influence unemployment statistics, as people working part-time while seeking full-time work represent a different category of labor market challenge.
Nonfarm payroll employment data complements unemployment statistics by showing job creation and destruction patterns. When nonfarm payroll employment increases significantly, unemployment rates typically decrease correspondingly, though labor force participation changes can complicate this relationship.
The relationship between unemployment rate measures and actual economic health involves multiple factors. Some states may have unchanged unemployment rates despite significant economic activity, while others experience percentage point changes that reflect major economic shifts.
Comprehensive unemployment analysis requires sophisticated tools that combine accurate data with intuitive visualization capabilities. Modern platforms offering interactive state and county selection, dual chart systems, and intelligent analytics provide invaluable resources for understanding complex labor market dynamics.
Whether you're a policy maker examining regional economic health, a business leader considering expansion locations, or a job seeker evaluating market conditions, access to detailed unemployment rate by state information empowers better decision-making. The combination of current statistics, historical trends, and predictive analytics creates a powerful foundation for understanding America's evolving job market landscape.